
 Q4 2024 Earnings Call Transcript")

")
Editor’s note: Seeking Alpha is proud to welcome Compounding Chef as a new contributing analyst. You can become one too! Share your best investment idea by submitting your article for review to our editors. Get published, earn money, and unlock exclusive SA Premium access. Click here to find out more »
Investment Thesis
When an investor purchases a share of any Vanguard fund, they are investing not only in the underlying assets held by the fund, but also gaining some ownership in Vanguard itself. The company is owned by the shareholders of Vanguard funds and ETFs, an approach pioneered by founder Jack Bogle to keep management fees as low as possible. Investors can combine an inexpensive 0.06% expense ratio with a diversified portfolio of high-quality companies with a growing dividend year after year for powerful compounding returns on their investment in the Vanguard Dividend Appreciation Index Fund ETF (NYSEARCA:VIG).
Compounding Works Both Ways
Compound interest is a two-way street. A growing dividend reinvested into a diversified portfolio of stocks has historically produced increasing returns in the long run. An expensive management fee for the same portfolio will eat away at those same returns each and every year. Vanguard has done extensive research studying the long-term effect of management fees for investors.
Costs play a crucial role in investor success. In either an actively managed fund or an index fund, each basis point an investor pays in costs is a basis point less an investor receives in returns. Since excess returns are a zero-sum game, as cost drag increases, the likelihood that the manager will be able to overcome this drag diminishes. Most investors’ best chance at maximizing net returns over the long term lies in minimizing these costs. In most markets, low-cost index funds have a significant cost advantage over actively managed funds.
VIG allows the compounding of dividend income and growth over time to work in your favor while minimizing the fees that work against you. A fund like VIG with an expense ratio of 0.06% will cost an investor significantly less to own than a much more popular SPDR S&P 500 ETF Trust (SPY) at a 0.09% expense ratio for a long term holding period.
Performance against the Benchmark
The benchmark for VIG is the S&P U.S. Dividend Growers Index, a portfolio of stocks with a historic track record on increasing dividends. From its inception on April 21, 2006, to the present day, VIG has a CAGR of 9.91% against the benchmark index at 10%.
The fund will hold all the stocks in the index in approximately the same proportions as their weightings in the index. The experience and stability of Vanguard’s Equity Index Group have permitted continuous refinement of techniques for reducing tracking error. The group uses proprietary software to implement trading decisions that accommodate cash flow and maintain close correlation with index characteristics. Vanguard’s refined indexing process, combined with low management fees and efficient trading, has provided tight tracking, net of expenses.
Technology Exposure with growing income
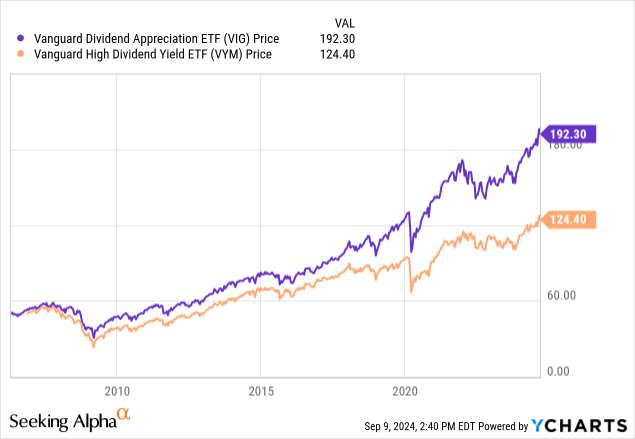
Dividend growth investment research into exchange-traded funds will often lead to a competition of strategies that focus on current income or dividend growth. The Vanguard High Dividend Yield Index Fund ETF (VYM) is a useful tool for comparison here. Both VIG and VYM have the same expense ratio and are focused on dividend-paying stocks, but there is a clear difference in strategy. The largest sectors in VYM are financials and consumer staples, while VIG holds more technology companies. I believe VIG occupies a sweet spot in between the tech-heavy S&P 500 ETF and a value-based ETF by providing a balance of current yield, dividend growth, and a diversified portfolio with earnings growth at a reasonable price.
| VIG Top Holdings | Ticker | Percent of Total Assets |
| Apple Inc. | (AAPL) | 4.56% |
| Broadcom Inc. | (AVGO) | 3.88% |
| MSFT | (MSFT) | 3.85% |
| JPMorgan Chase | (JPM) | 3.39% |
| Exxon Mobil | (XOM) | 2.98% |
| UnitedHealth | (UNH) | 2.94% |
| Visa | (V) | 2.22% |
| Mastercard | (MA) | 2.12% |
| Procter & Gamble | (PG) | 2.11% |
| Johnson & Johnson | (JNJ) | 2.11% |
The top holdings of VIG show a well-diversified approach, with Apple as the only stock above 4% of the total. There is additional exposure to growth oriented holdings through Microsoft and Broadcom, but the remainder of the top 10 occupy industries other than technology, bringing balance to the portfolio.
Meaningful Dividend Growth
According to the Seeking Alpha dividend scorecard for VYM, the current yield is 2.87% with a trailing 5-year dividend growth rate of 5.81%. VIG has a lower current yield at 1.74% with a significantly higher dividend growth rate of 10.26%. This table compares my expectations of dividend growth from each fund starting at the current yield and projecting divided growth into the future based on the last 5 years of dividend growth (without reinvested dividends).
| Year |
VYM Annual Dividend Per $1000 |
VIG Annual Dividend Per $1000 |
| 2024 | 29 | 17 |
| 2025 | 30.68 | 18.81 |
| 2026 | 32.47 | 20.80 |
| 2027 | 34.35 | 23.01 |
| 2028 | 36.35 | 25.46 |
| 2029 | 38.46 | 28.16 |
| 2030 | 40.70 | 31.15 |
| 2031 | 43.06 | 34.45 |
| 2032 | 45.56 | 38.12 |
| 2033 | 48.21 | 42.16 |
| 2034 | 51.01 | 46.64 |
| 2035 | 53.97 | 51.59 |
| 2036 | 57.10 | 57.08 |
| 2037 | 60.42 | 63.14 |
| 2038 | 63.94 | 69.84 |
| 2039 | 67.65 | 77.25 |
| 2040 | 71.58 | 85.46 |
| 2041 | 75.73 | 94.53 |
| 2042 | 80.14 | 104.58 |
| 2043 | 84.80 | 115.68 |
| 2044 | 89.72 | 127.96 |
While it is unlikely that the dividend growth of each fund will be exactly as predicted by the table above, it is a good exercise in the power of dividend growth in the long run. Choosing to reinvest the dividends paid out every quarter back into each ETF would increase returns even further. After 12 years, the stronger dividend growth from VIG could overtake the same invested in VYM. After 20 years, VIG could have achieved a yield on cost approaching 13% while VYM is lagging behind at 9%.
Long-term returns with higher starting yield like VYM are certainly still an investment win, albeit with a smaller potential for growth of the dividend into the future than VIG. If I were retired and needing a specific amount of income from my holdings, VYM could be the right option for me, with more income up front and a more conservative approach. A portfolio with average annual earnings growth of 11.6% like VYM over the last 5 years and return on equity of 16.7% could easily continue its track record of historic dividend growth, just at a slower pace than VIG with annual earnings growth of 13.3% over the last 5 years and return on equity of 27.2%.
Risks
While not as concentrated as the S&P 500, a significant portion of the portfolio is concentrated in Apple and Microsoft. If either company or any of the top holdings were to underperform in the long run the benchmark index would also suffer.
By excluding companies lacking in a long enough dividend history, VIG could miss out on returns from transformative growth opportunities like NVIDIA (NVDA) or Amazon (AMZN) and risk underperformance against the S&P 500.
Conclusion and Takeaway
For many investors, a low-cost index fund is an ideal way to match the market’s returns while keeping fees low. For investors looking to maximize income in the short run with a more conservative portfolio, VYM could be a great choice, providing a higher starting yield than the S&P 500. Among the choices of low-cost funds that prioritize dividend paying companies, I rate VIG a buy for its low cost and the potential for superior dividend growth from its diversified portfolio of stocks.
Read the full article here
 Q4 2024 Earnings Call Transcript")


")
