
 Q2 2024 Earnings Call Transcript")

")
Introduction
On June 16, 2023, we published a comparative article between Realty Income (O) and NNN REIT (NYSE:NNN) and while both stocks were recommended, the article concluded that Realty Income offered a better value at the time. NNN is down about 3.55% from the time of the publication of that previous article and we take this opportunity to review our analysis in light of the current macroeconomic conditions. In this article, we start by looking at how interest rates affect REITs in general terms. We outline the current environment that NNN operates in and infer how this might impact their performance. We then drill down and quantify how much value NNN is able to create in the current economic climate. We review their capitalization rate, or cap rate, and compare this with their current cost of capital. We then move to measure how much of the value created accrues to equity investors of NNN’s stock and compare this with an unbiased estimate of fair value for the shares. Throughout the article, we connect salient aspects of NNN’s business model with the quantitative metrics employed. When appropriate, we highlight differences with Realty Income, a key competitor. At the end, a conclusion is presented and an investment recommendation offered.
Four Ways Interest Rates Affect REITs
Please take a look at Exhibit 1 which presents the spread between the Implied Cap Rate of the Free Standing Retail Subsector and the US 10-year Treasury from 2014 to 2023 using quarterly periods. The figures for the US 10-year Treasury are lagged four quarters. We found a higher predictive power with the lag and interpret it to mean that it takes about a year for change in interest rates to have an impact on the cap rates.
Exhibit 1: Spread between 10-year Treasury and Implied Cap Rates. Source: St. Louis Fed and Nareit.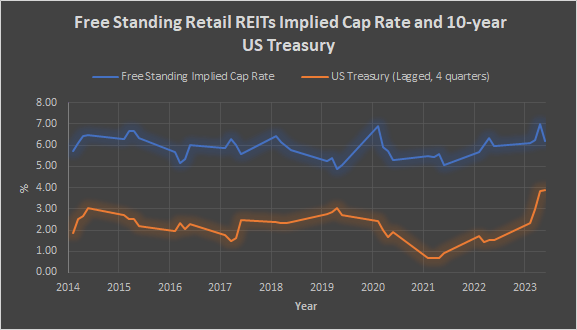
The average spread between the US 10-year Treasury and the implied cap rate during the period was 373 basis points. For Q4, 2023, that spread was only 233 basis points. Having a narrower-than-usual spread is a headwind for REITs. Investors could potentially shift their allocation from REITs into safer and relatively high-yielding fixed-income investments which would have the effect of depressing the stock price of REITs. For example, from January 2014 to December 2023 using monthly time periods, the dividend yield of the FTSE Nareit Equity Free Standing Index was, on average, 96 basis points above the effective yield of the ICE BofA BBB US Corporate Index. In February of this year, the yield differential was only 16 basis points.
Another potential issue with higher interest rates is when it comes time to refinance debt. REITs, by virtue of their legal structure, are required to distribute 90% of taxable income each year and are therefore dependent on external capital to finance growth. In an increasing interest rate environment, debt will have to be refinanced at a higher rate. As Kevin Habicht, NNN’s CFO, pointed out in the recent earnings call, there is a $350 million of 3.9% debt coming due in June. Replacing that debt with a ten-year issuance would probably have a mid-5% cost. This one refinance will unlikely make a material impact on NNN’s operating performance, but the longer interest rates stay elevated, the more debt that was issued at a lower interest rate regime will have to be refinanced at the higher rate.
The third reason that interest rates impact REITs has to do with the expectations of the level of future rates. If the expectation is that interest rates will begin to moderate later this year, then sellers of real estate may decide to wait until later in the year when financing is more accessible and consequently more buyers are active in the market. The CME FedWatch Tool has a 61.8% chance of a 25-basis cut for the June 12th FOMC Meeting.
Another potential headwind for REIT acquisition activity in 2024 versus 2023 is that in 2023 many regional banks were not deploying capital because they were dealing with their own crisis which was also caused by interest rates. Higher interest rates reduced the value of the assets on their books. Many regional banks adopted a posture of preserving capital rather than deploying capital. Here is NNN’s CEO Steve Horn commenting on the issue:
…the 2024 pipeline currently is not as large as 2023, but 2023 was a historic high for us, and that was a result of the banking market where our tenants on the regional banks weren’t deploying capital, so they came to us for money. So, we had a really strong year in 2023.”
I’m not going to say 2024 is going to be a larger opportunity in 2023 because the regional banks are starting to lend a little bit more.”
A final reason that interest rates may impact a REIT’s performance is that REIT tenants are themselves affected by higher rates. Higher interest expense reduces profitability and free cash flow. This last reason is probably not going to have much impact on NNN because their tenants are in relatively sound shape. When the collection of rental income from a tenant is deemed not probable, the tenant is switched to cash basis for accounting purposes. For 2023, 5% of NNN’s annual base rent was on cash basis. This is down from 7% in each of 2022 and 2021. Also, deferred rent agreements that were negotiated with tenants during the Covid-19 pandemic are being fulfilled by tenants on schedule.
Source: NNN REIT Annual Supplemental Data for 2023, Q4 2023 Earnings Call.
Now that we have a general idea of the macroeconomic setting that NNN operates in, let us quantify the value that their business model is able to generate currently.
Spread Investor
NNN owns 3,532 properties with an aggregate gross leasable space of about 36 million square feet located in 49 states. As of year-end, 99% of the properties leased with a weighted average lease term of 10.1 years. NNN leases the property on a triple-net basis which requires the tenant to pay all utilities and taxes associated with the property and maintain the interior and exterior of the property. In essence, NNN is a spread investor. They obtain capital from creditors and investors and put that capital to use by acquiring real estate assets and leasing them out on a triple-net basis. What makes this business model work is if NNN can access debt and equity markets and finance the acquisition of real estate at a lower rate than the rental income earned. NNN earns an economic profit that is the difference between the rent earned and the cost to acquire the real estate for which the rent is generated. For us to evaluate the health of their business, we need some measure of this economic profit or spread. The wider, the better. For a REIT, this spread can be estimated as the difference between the cap rate and the cost of capital. The cap rate is typically the net operating income divided by the asset value and the cost of capital is the cost of debt financing and the cost of equity financing in proportion to how much of each is used by the business.
Let us evaluate each of these.
Source: NNN REIT 10-K for 2023
Cap Rate
Please take a look at Exhibit 2 presents NNN REITs property acquisitions for 2021 through 2023. Clearly, NNN has adjusted their acquisition cap rates to reflect the macro picture. If we only consider Q4 2023 as disclosed in the earnings call, NNN deployed $270 million in 40 properties at an initial cap rate of 7.6%. We shall use this estimate as the cap rate NNN is able to achieve currently. For NNN to create value in today’s marketplace, their cost of capital must be less than 7.6%.
Exhibit 2: NNN Cap Rates. NNN REIT 10-K for 2023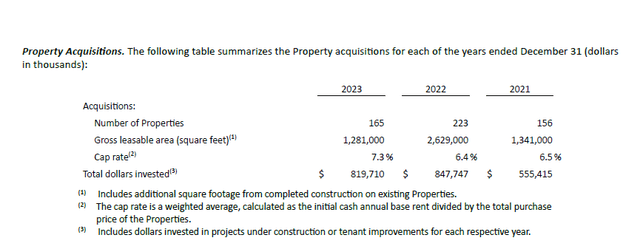
Cost of Capital: Debt
NNN enjoys an investment grade BBB+ long-term issuer rating from Standard & Poor’s and a Baa1 rating from Moody’s. A firm’s credit rating is focused on its credit risk. And credit risk has to do with assessing the obligor’s capacity to make promised principal and interest payments in accordance with the bond indenture. NNN has a 5.6% note that is trading at a premium to par that matures in October 2033. The note exchanged hands on April 3rd at a yield of 5.53%. We shall use this as our estimate of NNN’s cost of debt. Should NNN require to tap debt markets today, this is likely the cost they will incur for debt financing. Please take a look at Table 1 for details.
| Table 1: Issuer Rating and Cost of Debt | ||
| Description | Rating/Yield | Outlook/Maturity |
| Standard & Poor’s | BBB+ | Stable |
| Moody’s | Baa1 | Stable |
| 5.6% Note | 5.53% | October, 2033 |
Source: NNN REIT Institutional Investor Update, February 2024.
Cost of Capital: Equity
There are different methods and philosophies around calculating the cost of equity. We use the Capital Asset Pricing Model (CAPM) in which we essentially add a spread to the risk-free rate and scale the spread by the beta statistic of the particular stock. Let us review this in some detail. Please take a look at Table 2.
| Table 2: Cost of Equity | |
| β | 1.00 |
| Risk-free rate | 4.35% |
| Equity risk premium | 3.73% |
| Cost of equity | 8.08% |
Source: www.cnbc.com
The beta statistic is a measure of systematic risk. It is measured by regressing the returns of the stock against the market. The stock’s beta is a measure of risk that is of a different dimension than the credit risk measured as part of the estimate of the cost of debt. The emphasis with beta is how the levels of debt and the variability of the revenue stream impacts the stock price in relation to the market as a whole. In this particular case, the market is represented by the FTSE Nareit Equity Free Standing Index for which NNN REIT is a constituent. I’ve performed a regression on the monthly returns of NNN’s stock against that of the index and have come up with a beta of 1.0 which is not surprising given that it is the second largest constituent.
For the risk-free rate, I use the US 10-year Treasury which is a commonly used proxy for the risk-free rate.
The equity risk premium is simply the 373-basis point spread observed between the implied cap rate of the Free Standing Retail subsector and 10-year Treasury as mentioned at the top of the article. It is a measure of the premium required by investors over the 10-year Treasury given the risk profile of the asset class.
Now that we have the cost of debt and the cost of equity financing, we now weigh each source of capital in proportion to how much of each is used in the business. NNN does not have any preferred shares outstanding. Please look at Table 3 for NNN’s capital structure.
| Table 3: Capital Structure | ||
| Form of Capital | Value($ millions) | Weight |
| Equity market capitalization | $ 4,361 | 41.98% |
| Total debt | $ 6,026 | 58.02% |
| Total | $ 10,387 | 100% |
We now have the inputs we need to estimate NNN’s weighted average cost of capital. Please see Table 4.
| Table 4: Weighted Average Cost of Capital (WACC) | |
| Weight of debt | 58.02% |
| Weight of equity | 41.98% |
| Cost of debt | 5.53% |
| Cost of equity | 8.08% |
| WACC | 6.60% |
The tax shield normally included in the calculation of the WACC is ignored because REITs do not pay taxes at the corporate level.
In Table 5, we calculate the difference between NNN’s cap rate and the weighted average cost of capital. This spread is a measure of how much economic profit NNN is able to generate given their operating environment and their cost of capital. NNN is able to generate an economic profit of 100 basis points.
| Table 5: Cap Rate Minus WACC | |
| Cap Rate | 7.60% |
| WACC | 6.60% |
| Difference | 1.00% |
Generating 100 basis points of value in the current environment is a very good number. As a rough comparison, I recently calculated Realty Income’s value creation to be 86 basis points. It also exceeds the 35 basis points of value generated at the time of the previous article. There are caveats and differing assumptions employed in each article, so a precise differential would not be appropriate. Having said that, in my view, it is fair to say that NNN probably creates more value as a business than Realty Income currently and that it creates more value today than in June 2023..
Creating value as a business is a necessary but not a sufficient reason to consider an investment in the stock. It is just as important to ask “To whom does that value accrue to?” Management? Fixed income holders? Equity investors?
To answer this question, we revisit the cost of equity calculation we performed when we estimated the cost of capital.
We estimated the cost of equity using CAPM which is a statistical method of ascertaining the cost of equity. There are other methods to calculate the cost of equity. Also, cost of equity is the terminology used from the company’s perspective. It is the cost for them to obtain equity capital. From an investor’s point of view, the cost of equity is the required rate of return. And for many investors, particularly REIT investors, the required rate of return has two components: the current dividend yield and the growth rate of the dividends.
Please take a look at Table 6 which presents NNN’s total return as a combination of the current dividend yield and the growth rate of the dividends.
| Table 6: Total Return | |
| Dividend yield | 5.44% |
| 10-year dividend CAGR | 3.40% |
| Total return | 8.84% |
Source: Seeking Alpha
In Table 7, we compare the total return with the cost of equity calculated using CAPM. The cost of equity in this case can be thought of as the opportunity cost for investing in the stock akin to a “hurdle rate”. The spread of 76 basis points suggests that NNN’s stock is priced with some margin of safety.
| Table 7: Total Return Minus Cost of Equity | |
| Total return | 8.84% |
| Cost of equity | 8.08% |
| Difference | 0.76% |
Conclusion
Despite the macro headwinds, NNN was able to capitalize on opportunities in 2023. Their acquisition volume was positively impacted by headwinds for regional banks. While, they do face the prospect of refinancing debt at higher interest rates as they come due, this will probably be offset by the positive trends in cap rates as evidenced by the 7.6% cap rate achieved in Q4 2023 versus 7.3% for all of 2023. This is also well above the ten-year average implied cap rate of the subsector of 5.91%.
NNN has a proud 34-year history of dividend increases. For those contemplating exposure to the Free Standing Retail space at a reasonable price with a shareholder oriented management team at the helm, NNN’s stock offers a good value.
Read the full article here
 Q2 2024 Earnings Call Transcript")


")